In May, Pacifecon’s monthly Market Watch report looked at the private sector. This sector makes up 53% of all projects and 54% of the value of work in the national pipeline, and when compared to the same time last year both percentages have remained the same. We’re here now to delve into some of the trends our research team have been reporting on across two reports.
Our Market Watch provides analysis focusing on newly reported projects, progression of existing projects, construction starting and cancellations across key sectors; commercial, residential and infrastructure for New Zealand regions and the Pacific Islands. Each edition explores a different feature; let’s break down the private sector.
Private Sector
Auckland has 46% of the number and 39% of the value of all private sector pipeline projects. This is followed by Waikato/Bay of Plenty, which has 13% of the number and 20% of the value, LCNI has 11% in both number and value, and Canterbury has 10% of the number and 9% of the value.
One private sector project we shone the spotlight on for this Market Watch was the Pan Pac Forestry Processing Site. Based at Whirinaki, near Napier, New Zealand. Work is underway for restoration of the site due to Cyclone Gabrielle flooding. Completion on the project is expected in 2025 and other contacts that we are reporting on include architects, engineers, consultants, suppliers and contractors. In January of this year, the mill site was seen to have steam billowing from its boilers after almost a year of rebuilding.
Local Government Sector
The focus of our latest Market Watch is the Local Government Sector. This makes up 35% of the New Zealand pipeline of work by number and 20% by value, and not surprisingly 75% of local government projects are civil. This means local councils are spending the majority of their funding on key services such as transport, water and infrastructure. As of the end of July, the pipeline has 7,388 local government sector projects valued at $69b.
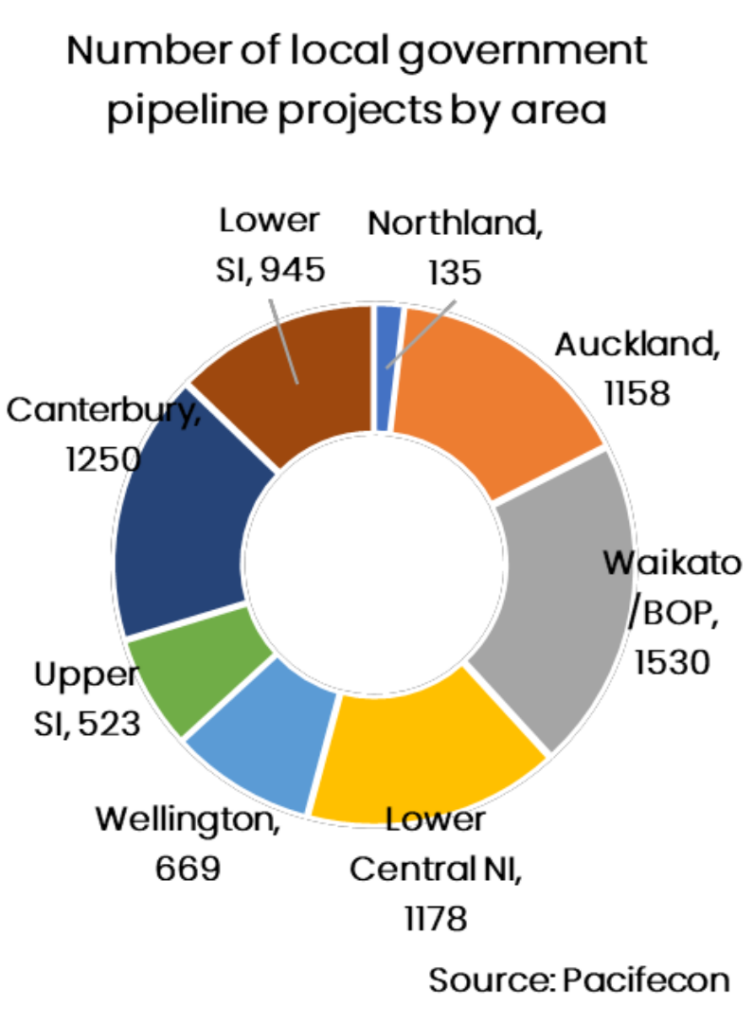
We’re reporting on a number of relevant reported projects for regions including Northland, Auckland, Waikato/Bay of Plenty, Wellington, Canterbury, and more. As of July the North Island has 63% of the number and 83% of the value of local government pipeline work. 69% of the projects are in early planning, at a value of 81% of pipeline work. 26% of the projects are in planning status with 18% of the value. 5% of the projects are being tendered but are only 2% of the value of planned pipeline work.
One project we’d like to shine a spotlight on is the Carrington residential development, Te Auaunga Precinct – Southern Precinct new build in Mt Albert. This development will be complementary to the existing neighbourhood and will be low to medium density at two to five storeys with 50 to 80 dwellings per hectare. The project started earlier this year and involves redevelopment of the Unitec Campus into an urban village, in a partnership between the Crown & Mana Whenua project partners Tamaki Makaurau Ropu of Marutuahu, Ngati Whatua & Waiohua-Tamaki over a 10-15 year time span.
In addition to a highlighted project breakdown, each Market Watch includes commentary and graphs for regions. It provides a comprehensive picture of planned construction across the country to help your business.
Be informed, make strategic decisions based on projects planned and what has started, drive business growth, understand which regions are right for your future, and identify which sectors are growing in the regions. Head here to download sample reports or contact us today to order your copy of Market Watch.
Comments are closed.